It watches while you sleep.
Self-hosted log anomaly detection for teams that do not want to build a full monitoring stack. Add a source, upload a log file, set three alerts, and let Parsen watch for what changed.
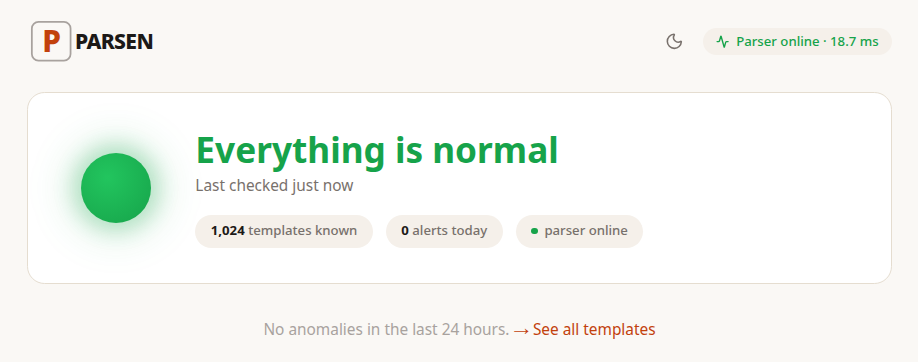
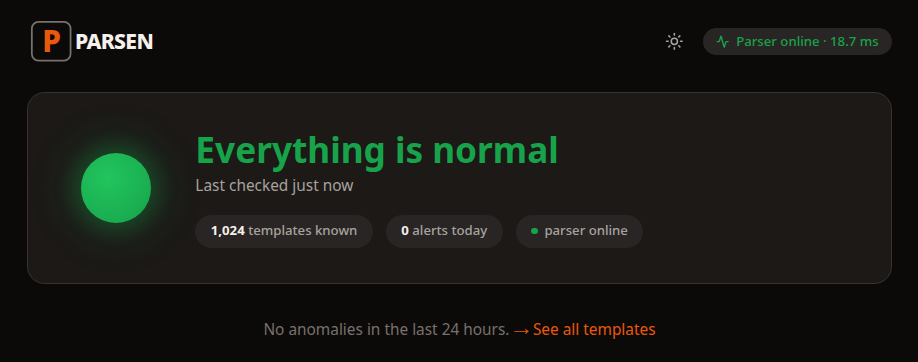
What You See First
Know the state fast. See what changed next.
The homepage should answer the operator's first question immediately: is the system healthy, what changed, and where should I look next?
How you start
No parser regex to write. No ingestion pipeline to configure. You provide the logs. Parsen learns the patterns.
Download Parsen
Run it on your own machine or server.
Add your service
Create a source in the dashboard for the service you want to watch.
Upload a normal log file
Parsen learns what normal looks like from a normal period of operation.
Set three alerts
New pattern, silence, and sudden spike are enough to start.
Done
Parsen keeps watching and points you to what changed.
What You Actually Get
Monitoring that tells you what changed
Parsen is focused software. It learns your patterns, watches for deviations, and keeps the operator workflow short.
Alerts when a new pattern appears
If your service starts logging something it never logged before, Parsen flags it.
Alerts when a known pattern goes silent
If a recurring heartbeat or expected event stops showing up, Parsen flags that too.
Alerts when something is firing far more than usual
Sudden surges stand out against what normal looked like before.
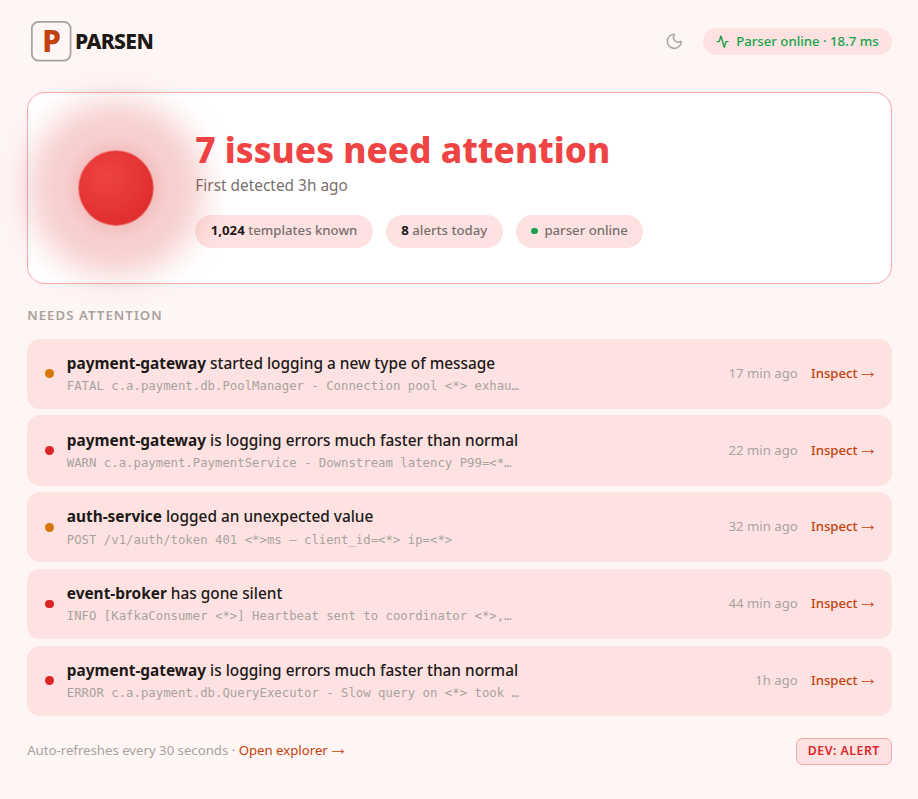
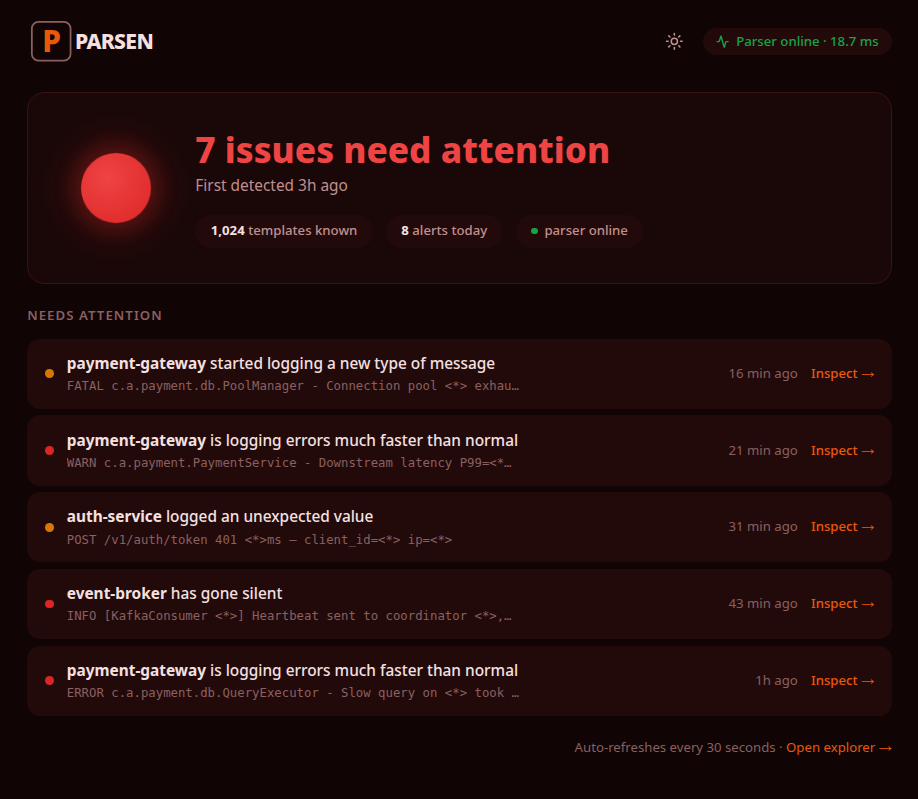
A dashboard that shows what changed
You do not start with a wall of logs. You start with the unusual patterns worth opening.
Deploys
Deploy without breaking monitoring
Every deploy changes logs a little. Parsen treats that as something to review, not something that forces a monitoring rebuild.
New patterns get flagged
After a deploy, Parsen surfaces new patterns so you can inspect what changed intentionally and what did not.
Acknowledge expected changes once
Review the expected patterns, acknowledge them, and let the grammar mature over time.
No dashboard rebuild
You are not rewriting parsers and retuning dashboards every time application logs evolve.
One person can run it
A modest VPS is enough. Parsen is built for the operator who also has other work to do.
FAQs
Common questions
Do I need labeled data to start?
No. Most users start by uploading a normal log file and letting Parsen analyse it. If you have labeled CSV data, you can use that path for higher day-one accuracy.
Does it replace a full observability platform?
No. Parsen is focused on log pattern learning and anomaly detection. It is not distributed tracing, long-term full-text log storage, or a broad observability suite.
Does my data leave my infrastructure?
No. Parsen is self-hosted. Your logs stay on your own machine or server.
Your logs have been trying to tell you things.
Start listening without building a full monitoring project around them.