Incidents Simplified
Something’s wrong. Open Parsen.
Two clicks to the answer. No digging. No querying. No guessing.
The Moment
The moment you actually need monitoring
A customer messages you. Something is slow, broken, or just off. You do not know what. That is the moment most tools fail by forcing you to know what to search for first.
You do not know where to start
Search-heavy tools assume you already know the right query or service to open first.
Parsen starts with what changed
The first useful screen is the unusual thing, not the full universe of logs.
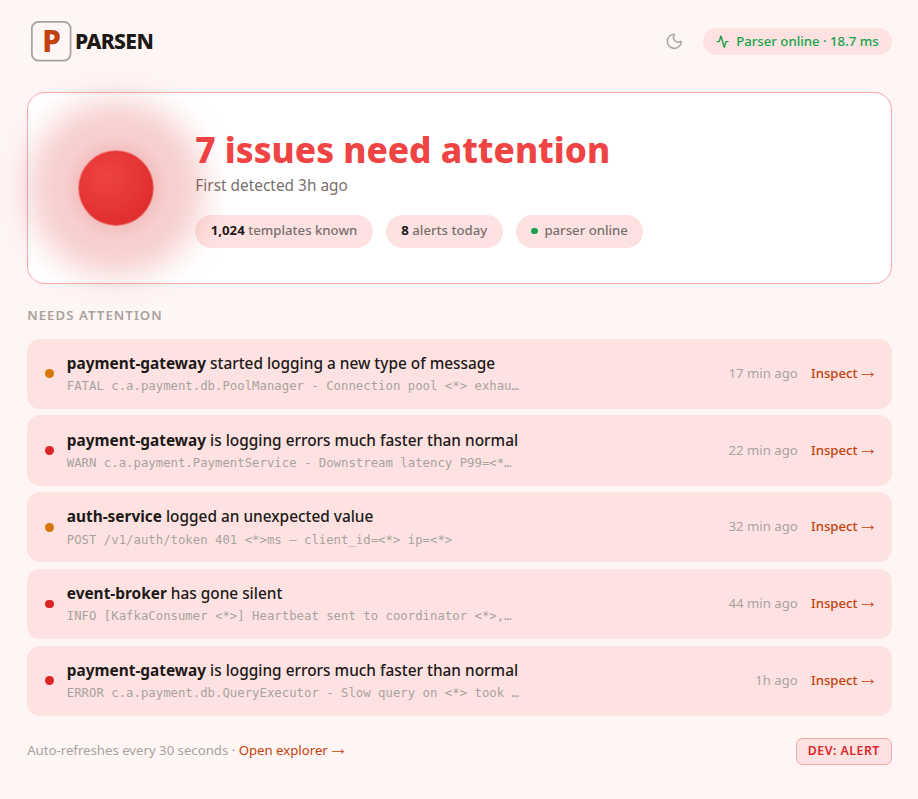
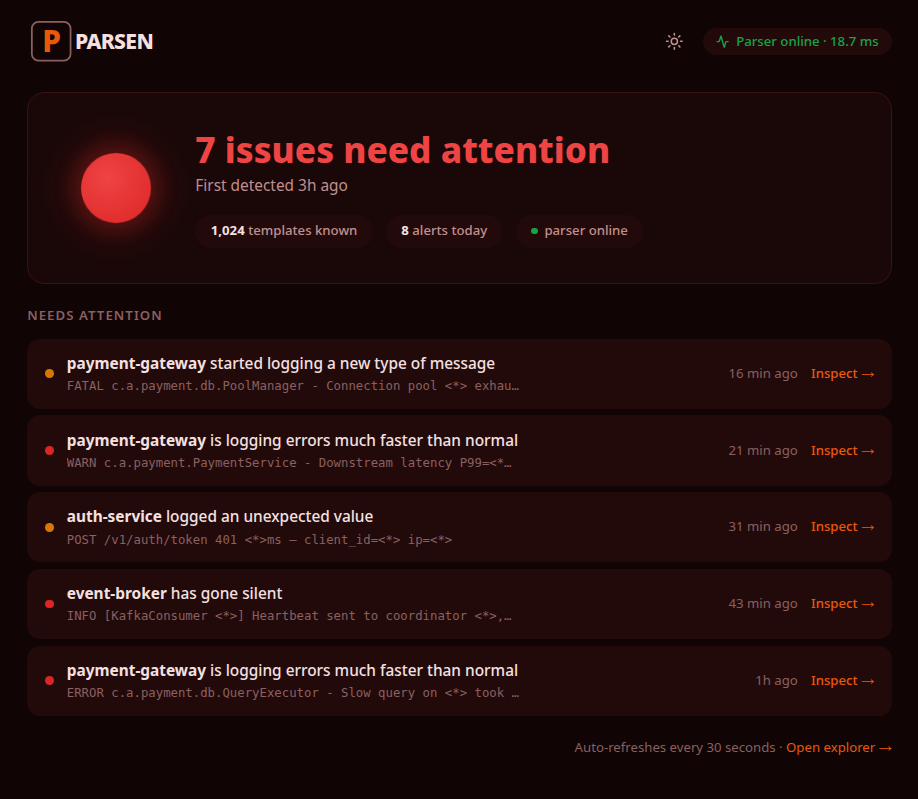
What happens when you open Parsen
Click 1 — Open the dashboard
Parsen shows what changed, not a wall of unrelated data.
See the unusual pattern
New error type, suspicious silence, or a pattern quietly surging for the last hour.
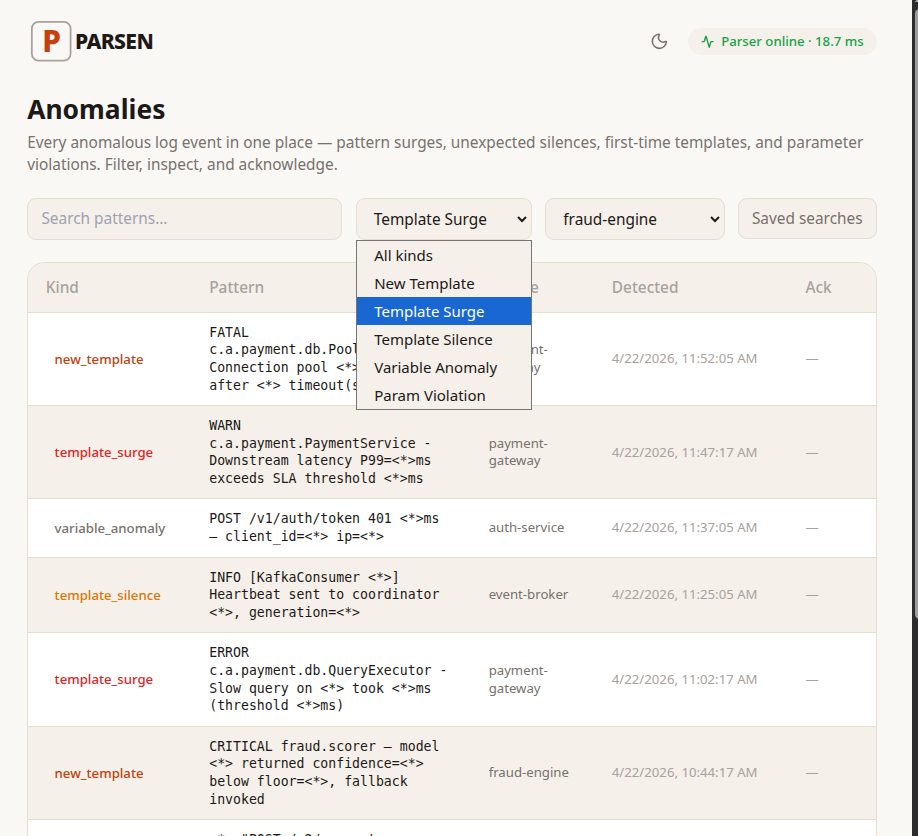
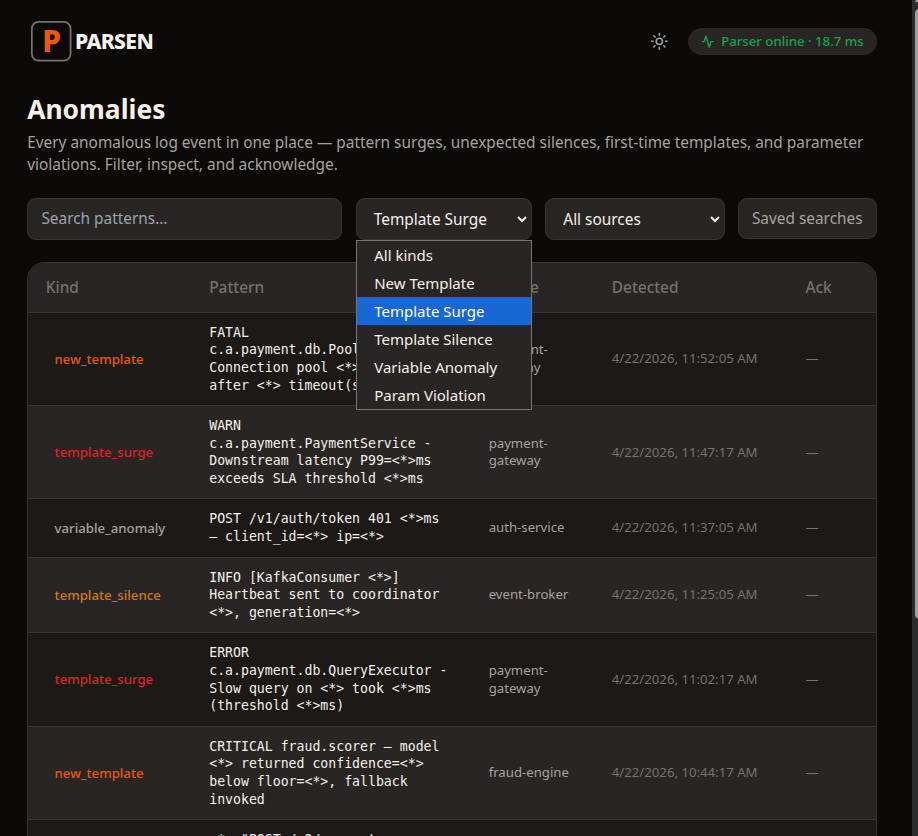
Click 2 — Open the anomaly
You see which service, what changed, when it started, and how far from normal it is.
Know where to look next
That is usually enough to narrow the real investigation quickly.
Why This Feels Different
Search is useful. It is not the same as guidance.
Other tools store logs and let you search them. Parsen tries to reduce the investigation before the search begins.
It was already watching
By the time you open Parsen, the product has already noticed the anomaly and surfaced it.
Simple alert rules
You configure a small set of alert rules once instead of maintaining a large dashboard-and-query system.
Incident workflow first
The product is organized around helping you decide what to inspect next, fast.
Next time something breaks, have an answer in two clicks.
Parsen is built for the operator who needs to know what changed before the investigation turns into a 45-minute search session.